Master's Project
Active Citizens in Smart Cities

Background
The City of Atlanta has plans to install 18 sensor boxes locations along a particular street, North Avenue. As of January 2016, two have been installed. They will sense things like temperature, noise, and air quality. In addition, real-time video analysis will provide data such as the number of people in the area.
Broad goal: Contribute to the design space of smart cities by exploring how people who live in the city, rather than government planners or managers, might benefit from generated data on a regular basis.
Specific goal: Design and prototype a useful artifact with an interface for people who live in the city to interact with the generated data, based on user research.
My role: As my Master's Project, everything: researcher, designer, maker, manager, etc
My full presentation for this project can be viewed here and the comprehensive report can be read here.

One of the sensor boxes installed along North Avenue
Users
To narrow the scope of the project, I decided to focus on people who run in the city. There are a few reasons behind this decision:
Runners move through the city, sometimes at great distances, as pedestrians - navigating sidewalks, crosswalks, parks, etc. This means they are intimately familiar with the city.
Many runners are familiar with data and use it during their runs. For example, a runner might have a Garmin GPS-enabled watch or a FitBit and receive data like mileage, pace, and heart rate.
Runners are generally healthy and active, which are attributes of residents cities pride themselves on having.

Runners on the Atlanta Beltline
Design Ideation
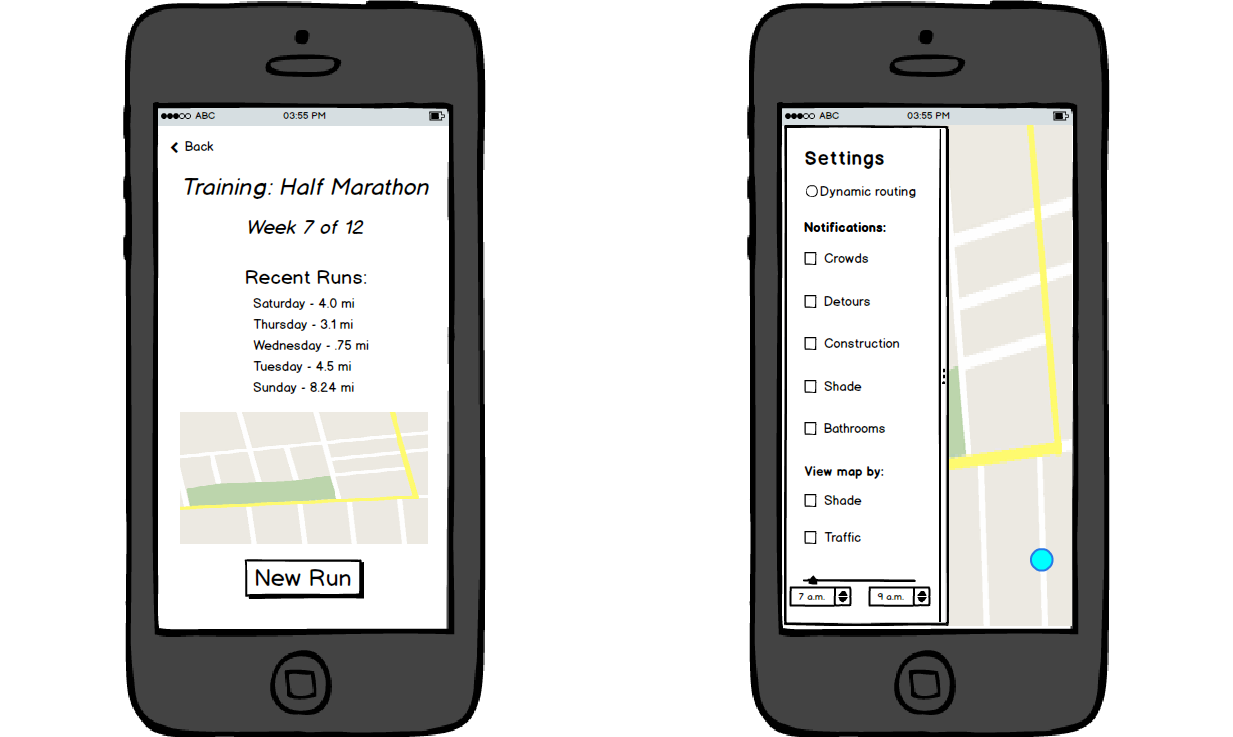
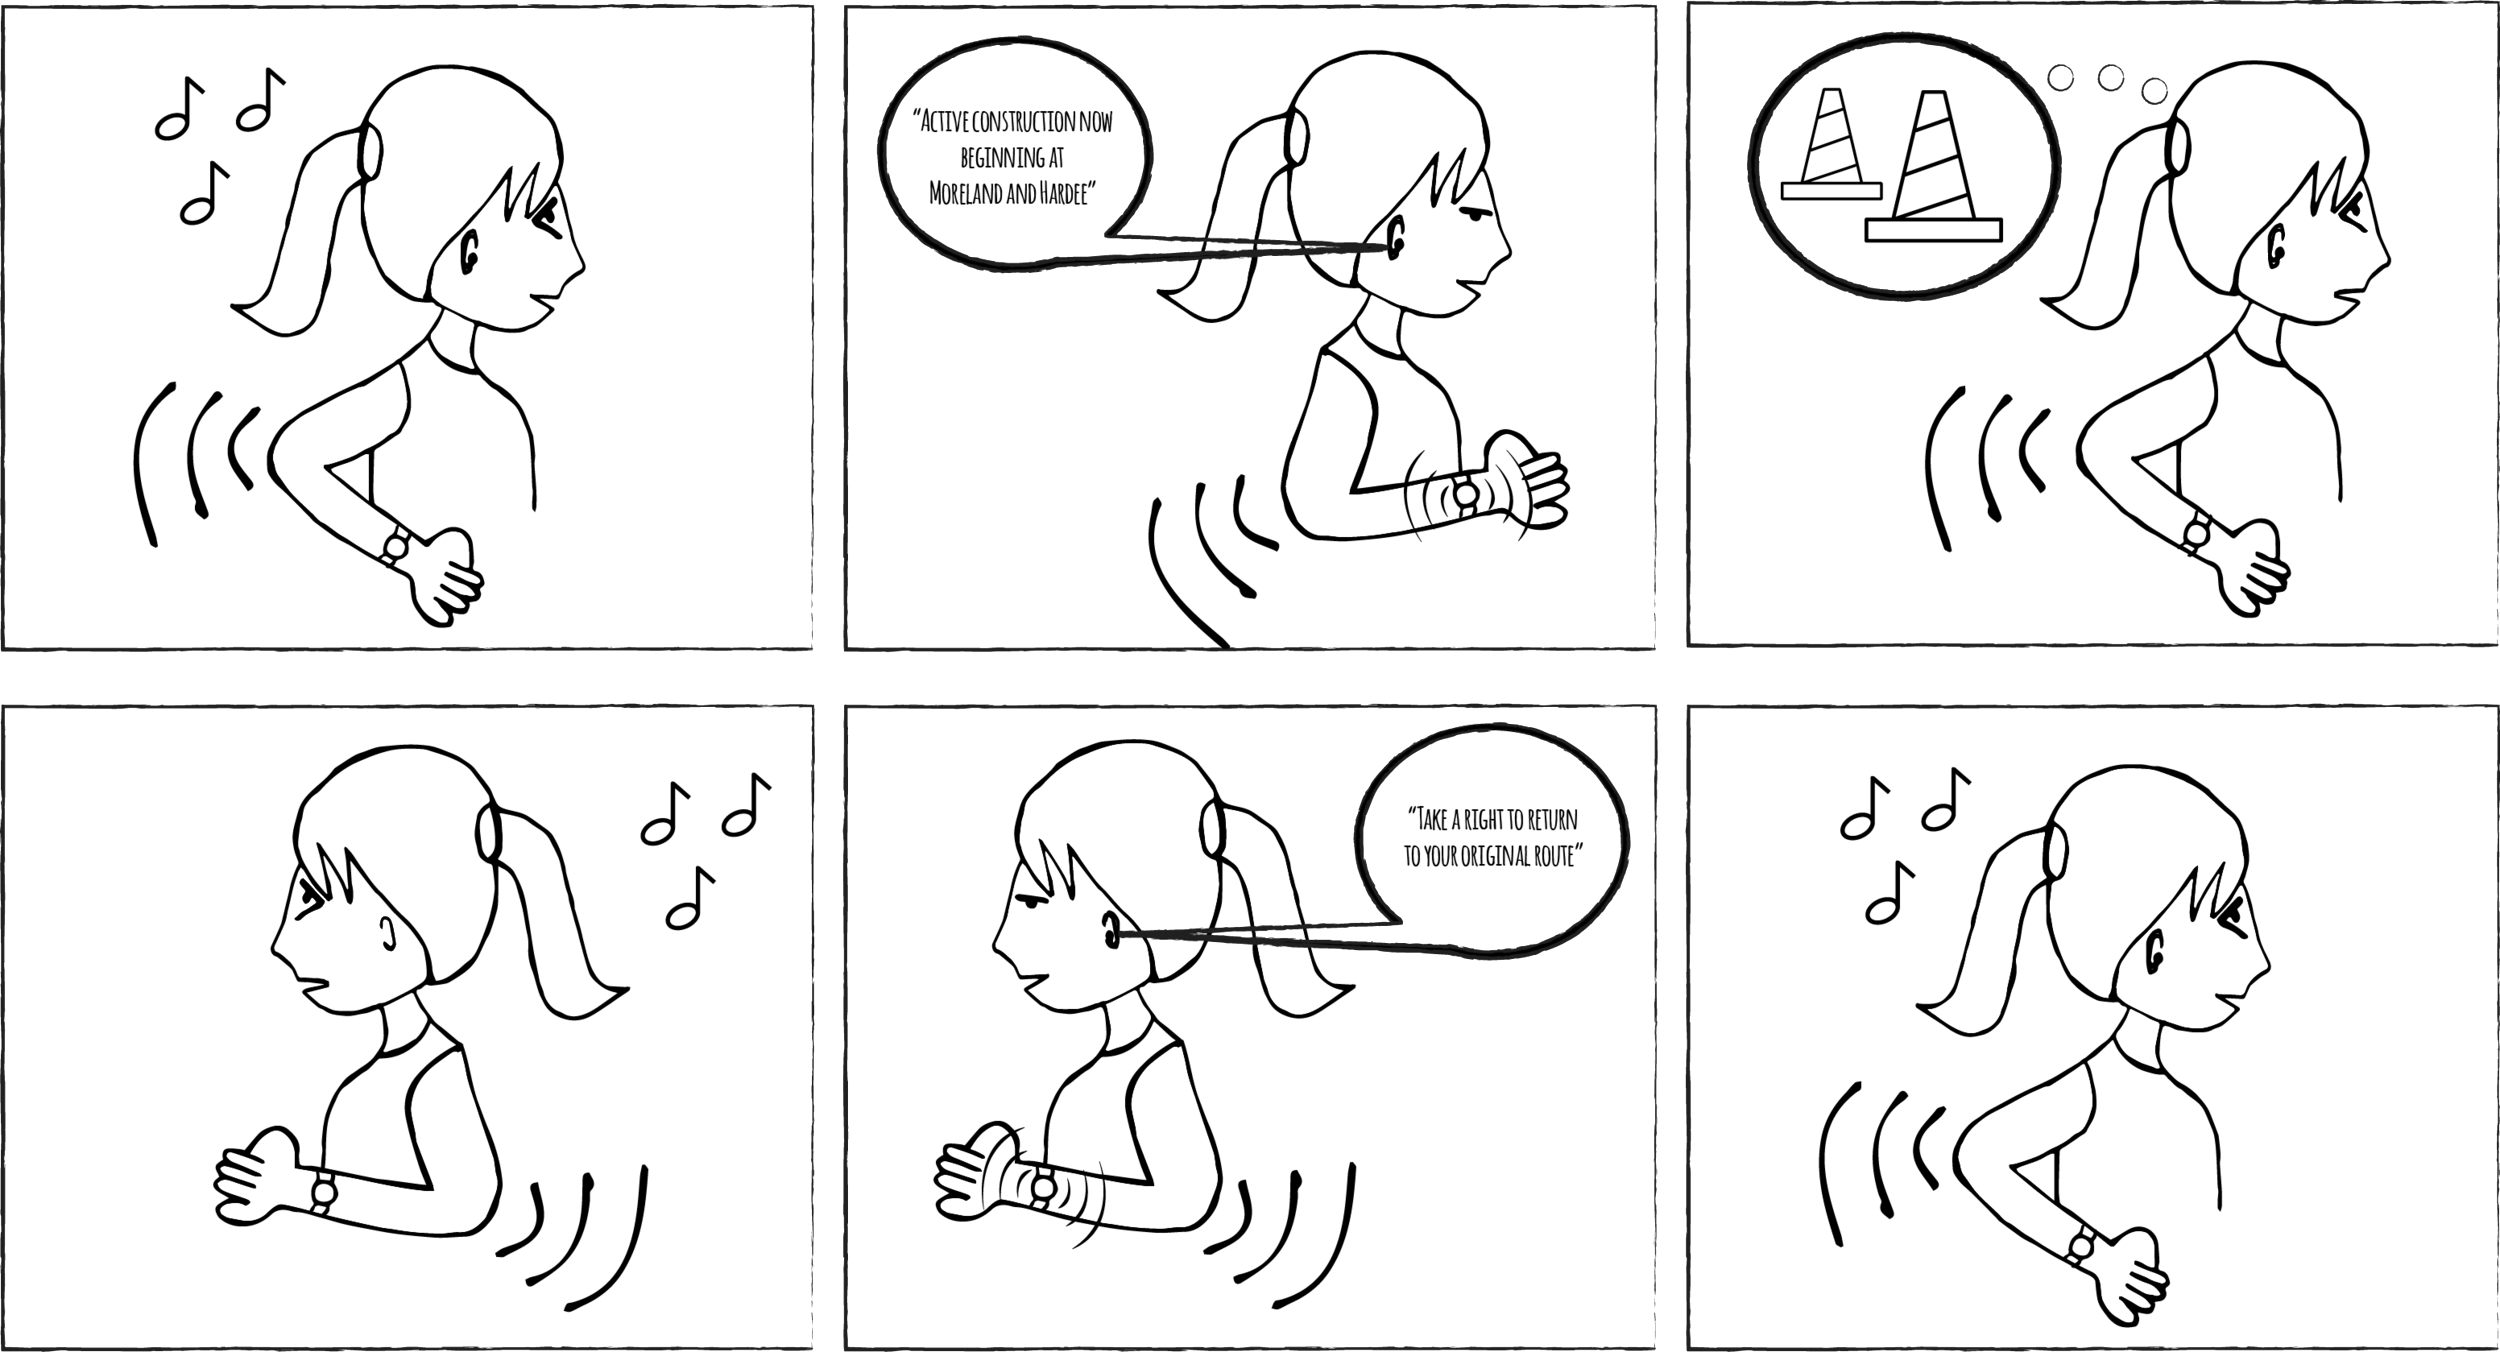
Drawing on my personal experience as a runner, knowledge of the City of Atlanta, and initial discussions with coworkers, I brainstormed ideas of how runners might use the data. After thinking of a few ideas, I illustrated one through basic wireframes for a mobile app in Balsamiq. I also drafted a fictional scenario.
Concept Development
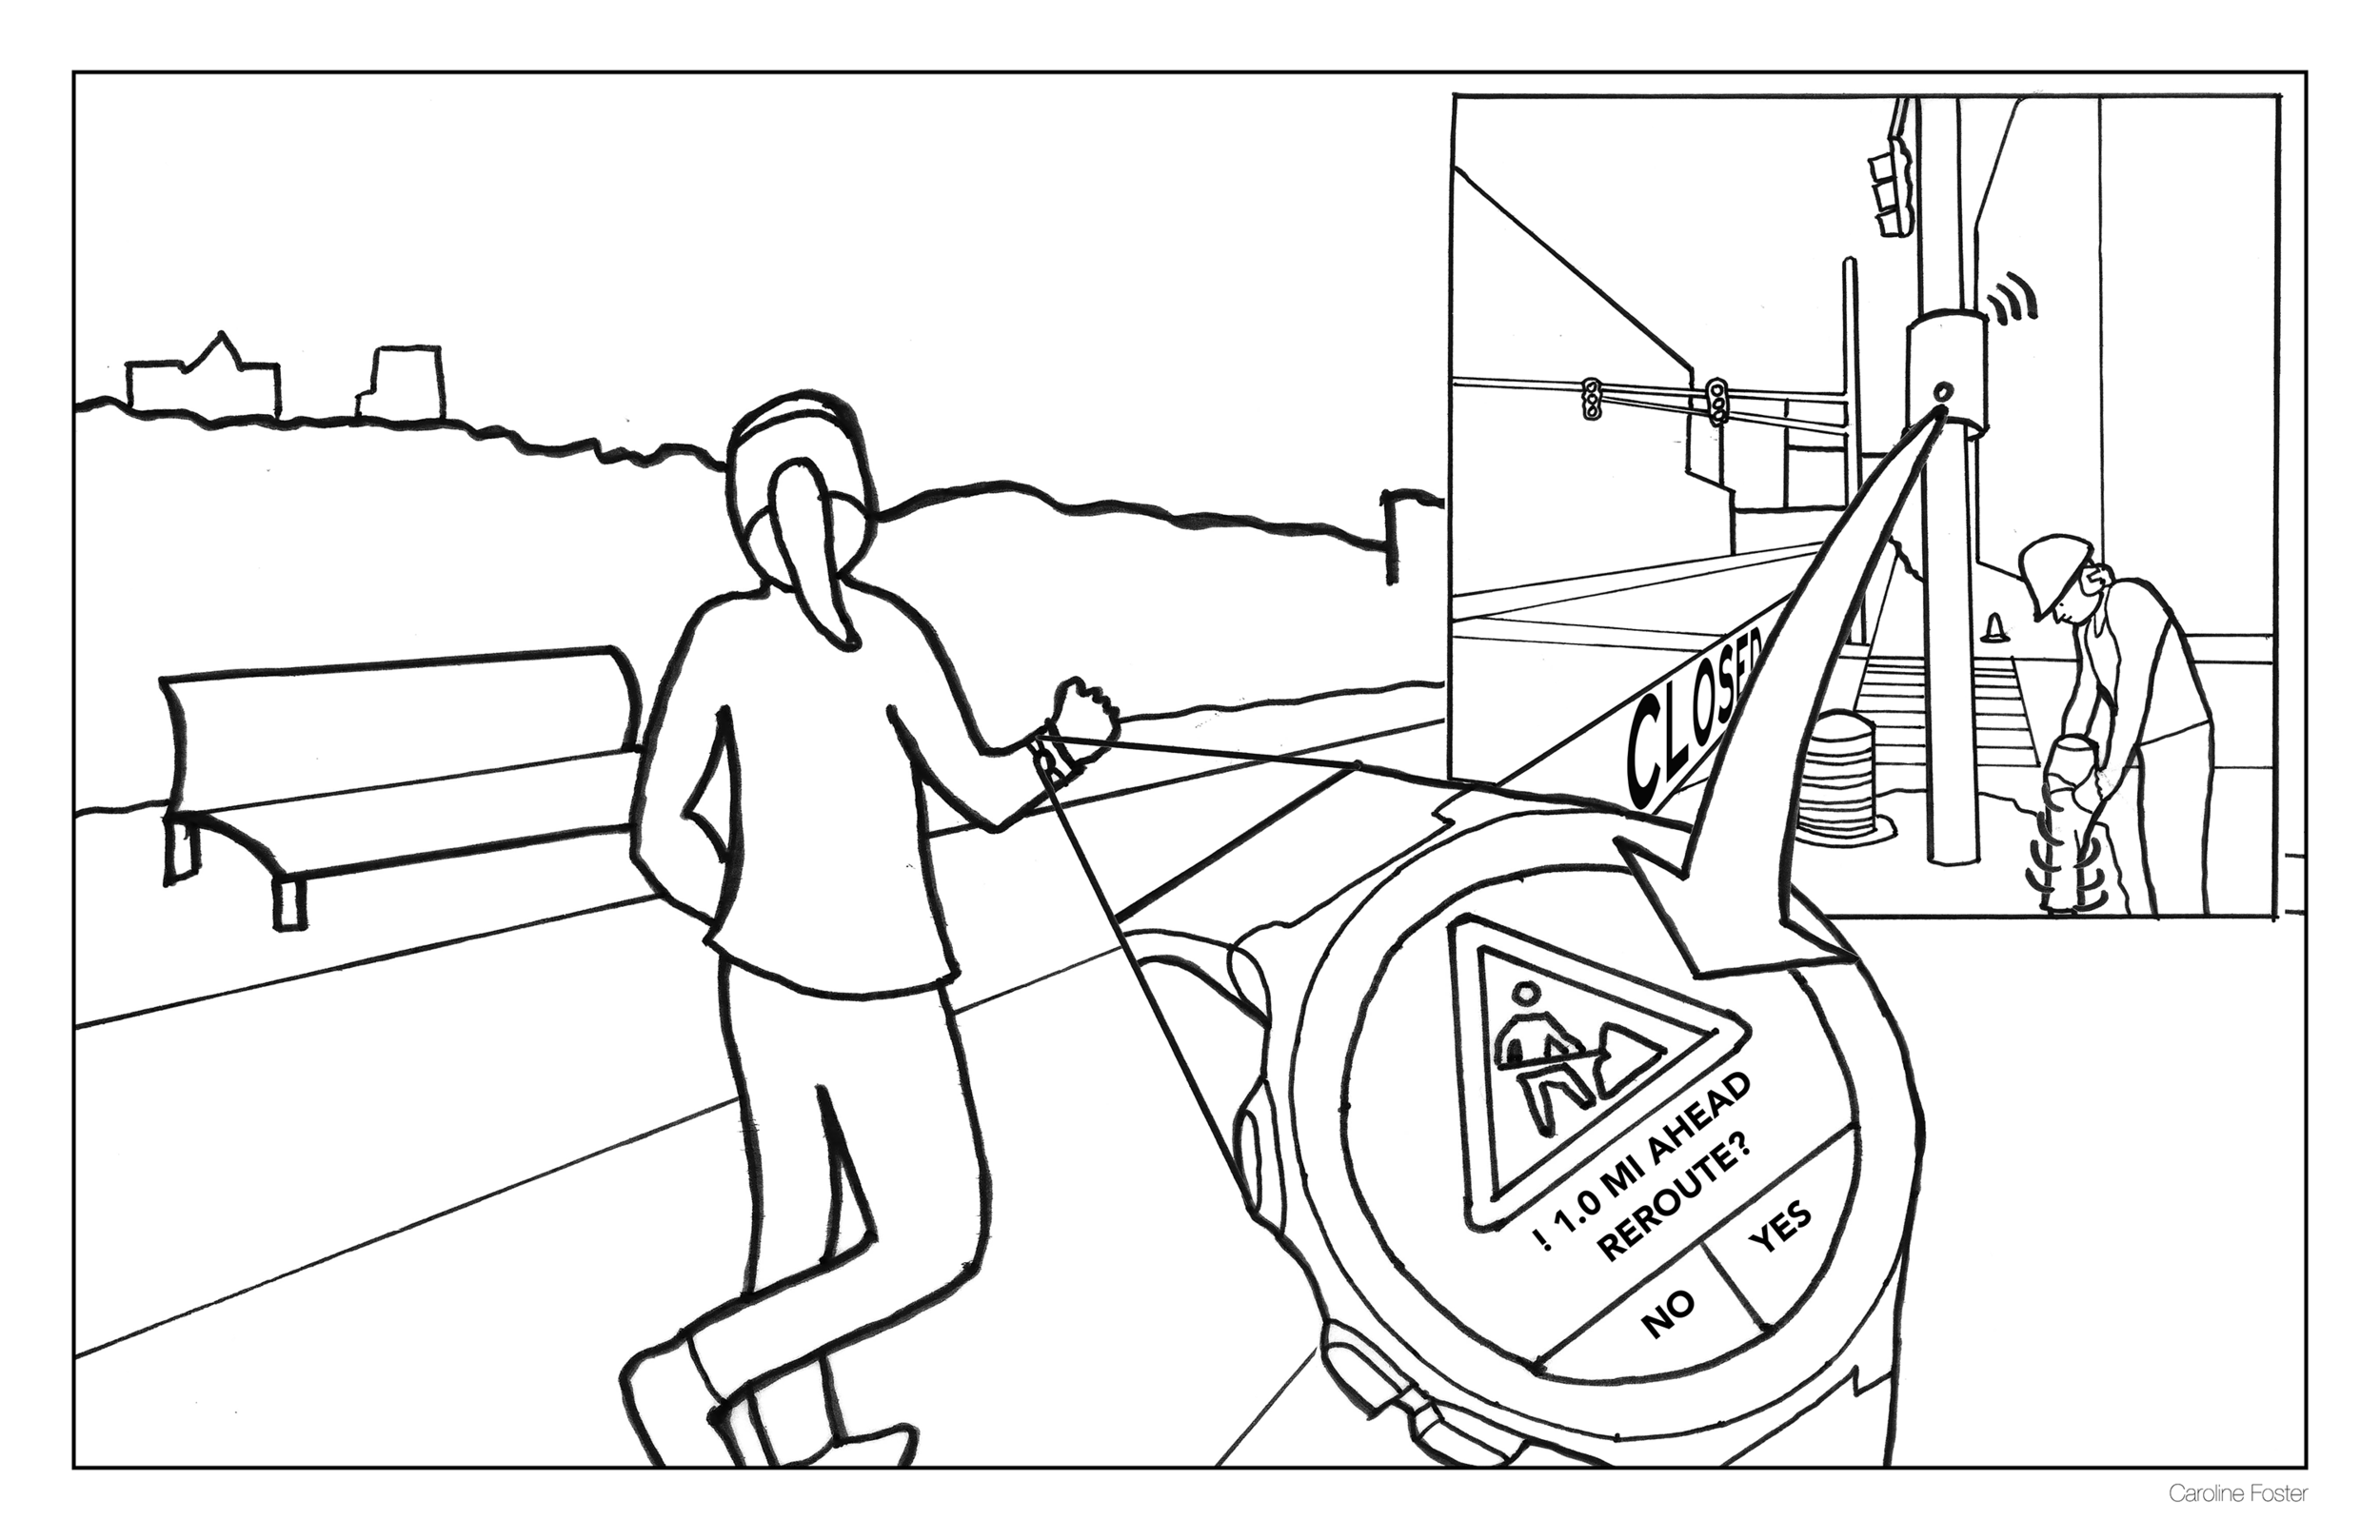
For this particular project, I created a few different concepts integrating running and the sensors before completing user research. As part of my design process, sketching the ideas helped me convey the concepts in my mind and various options to pursue - even if they might not be taken any further.
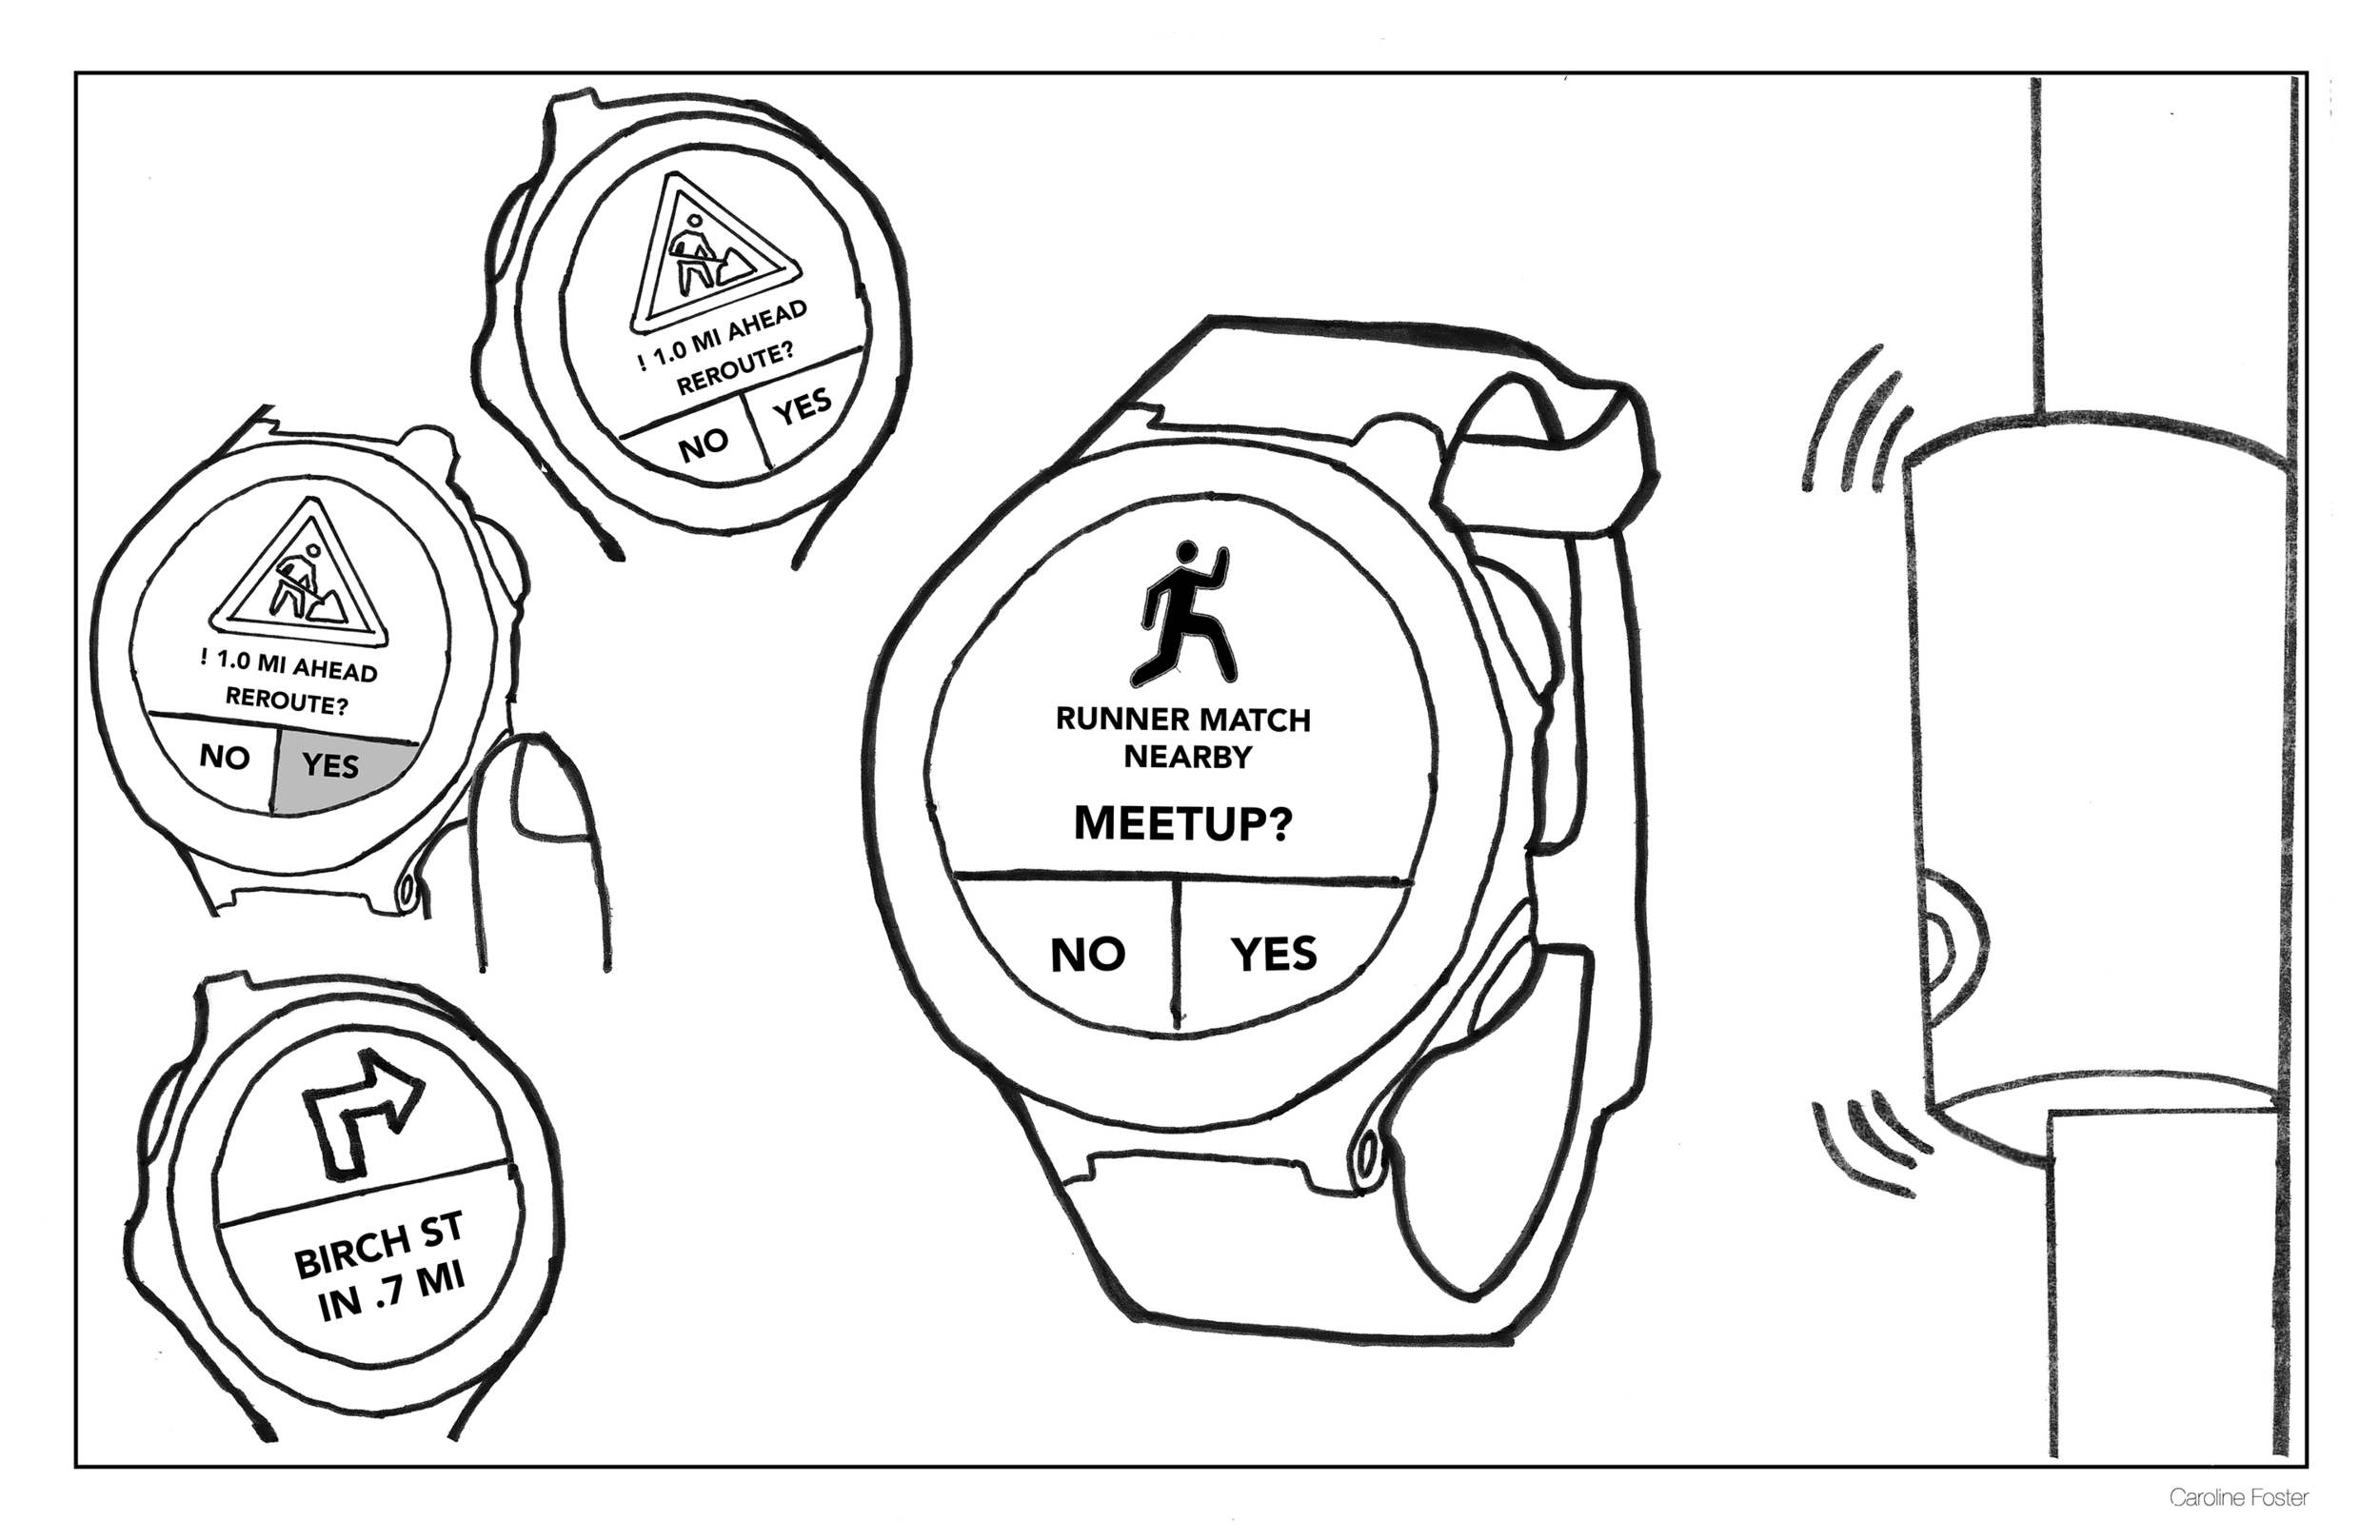
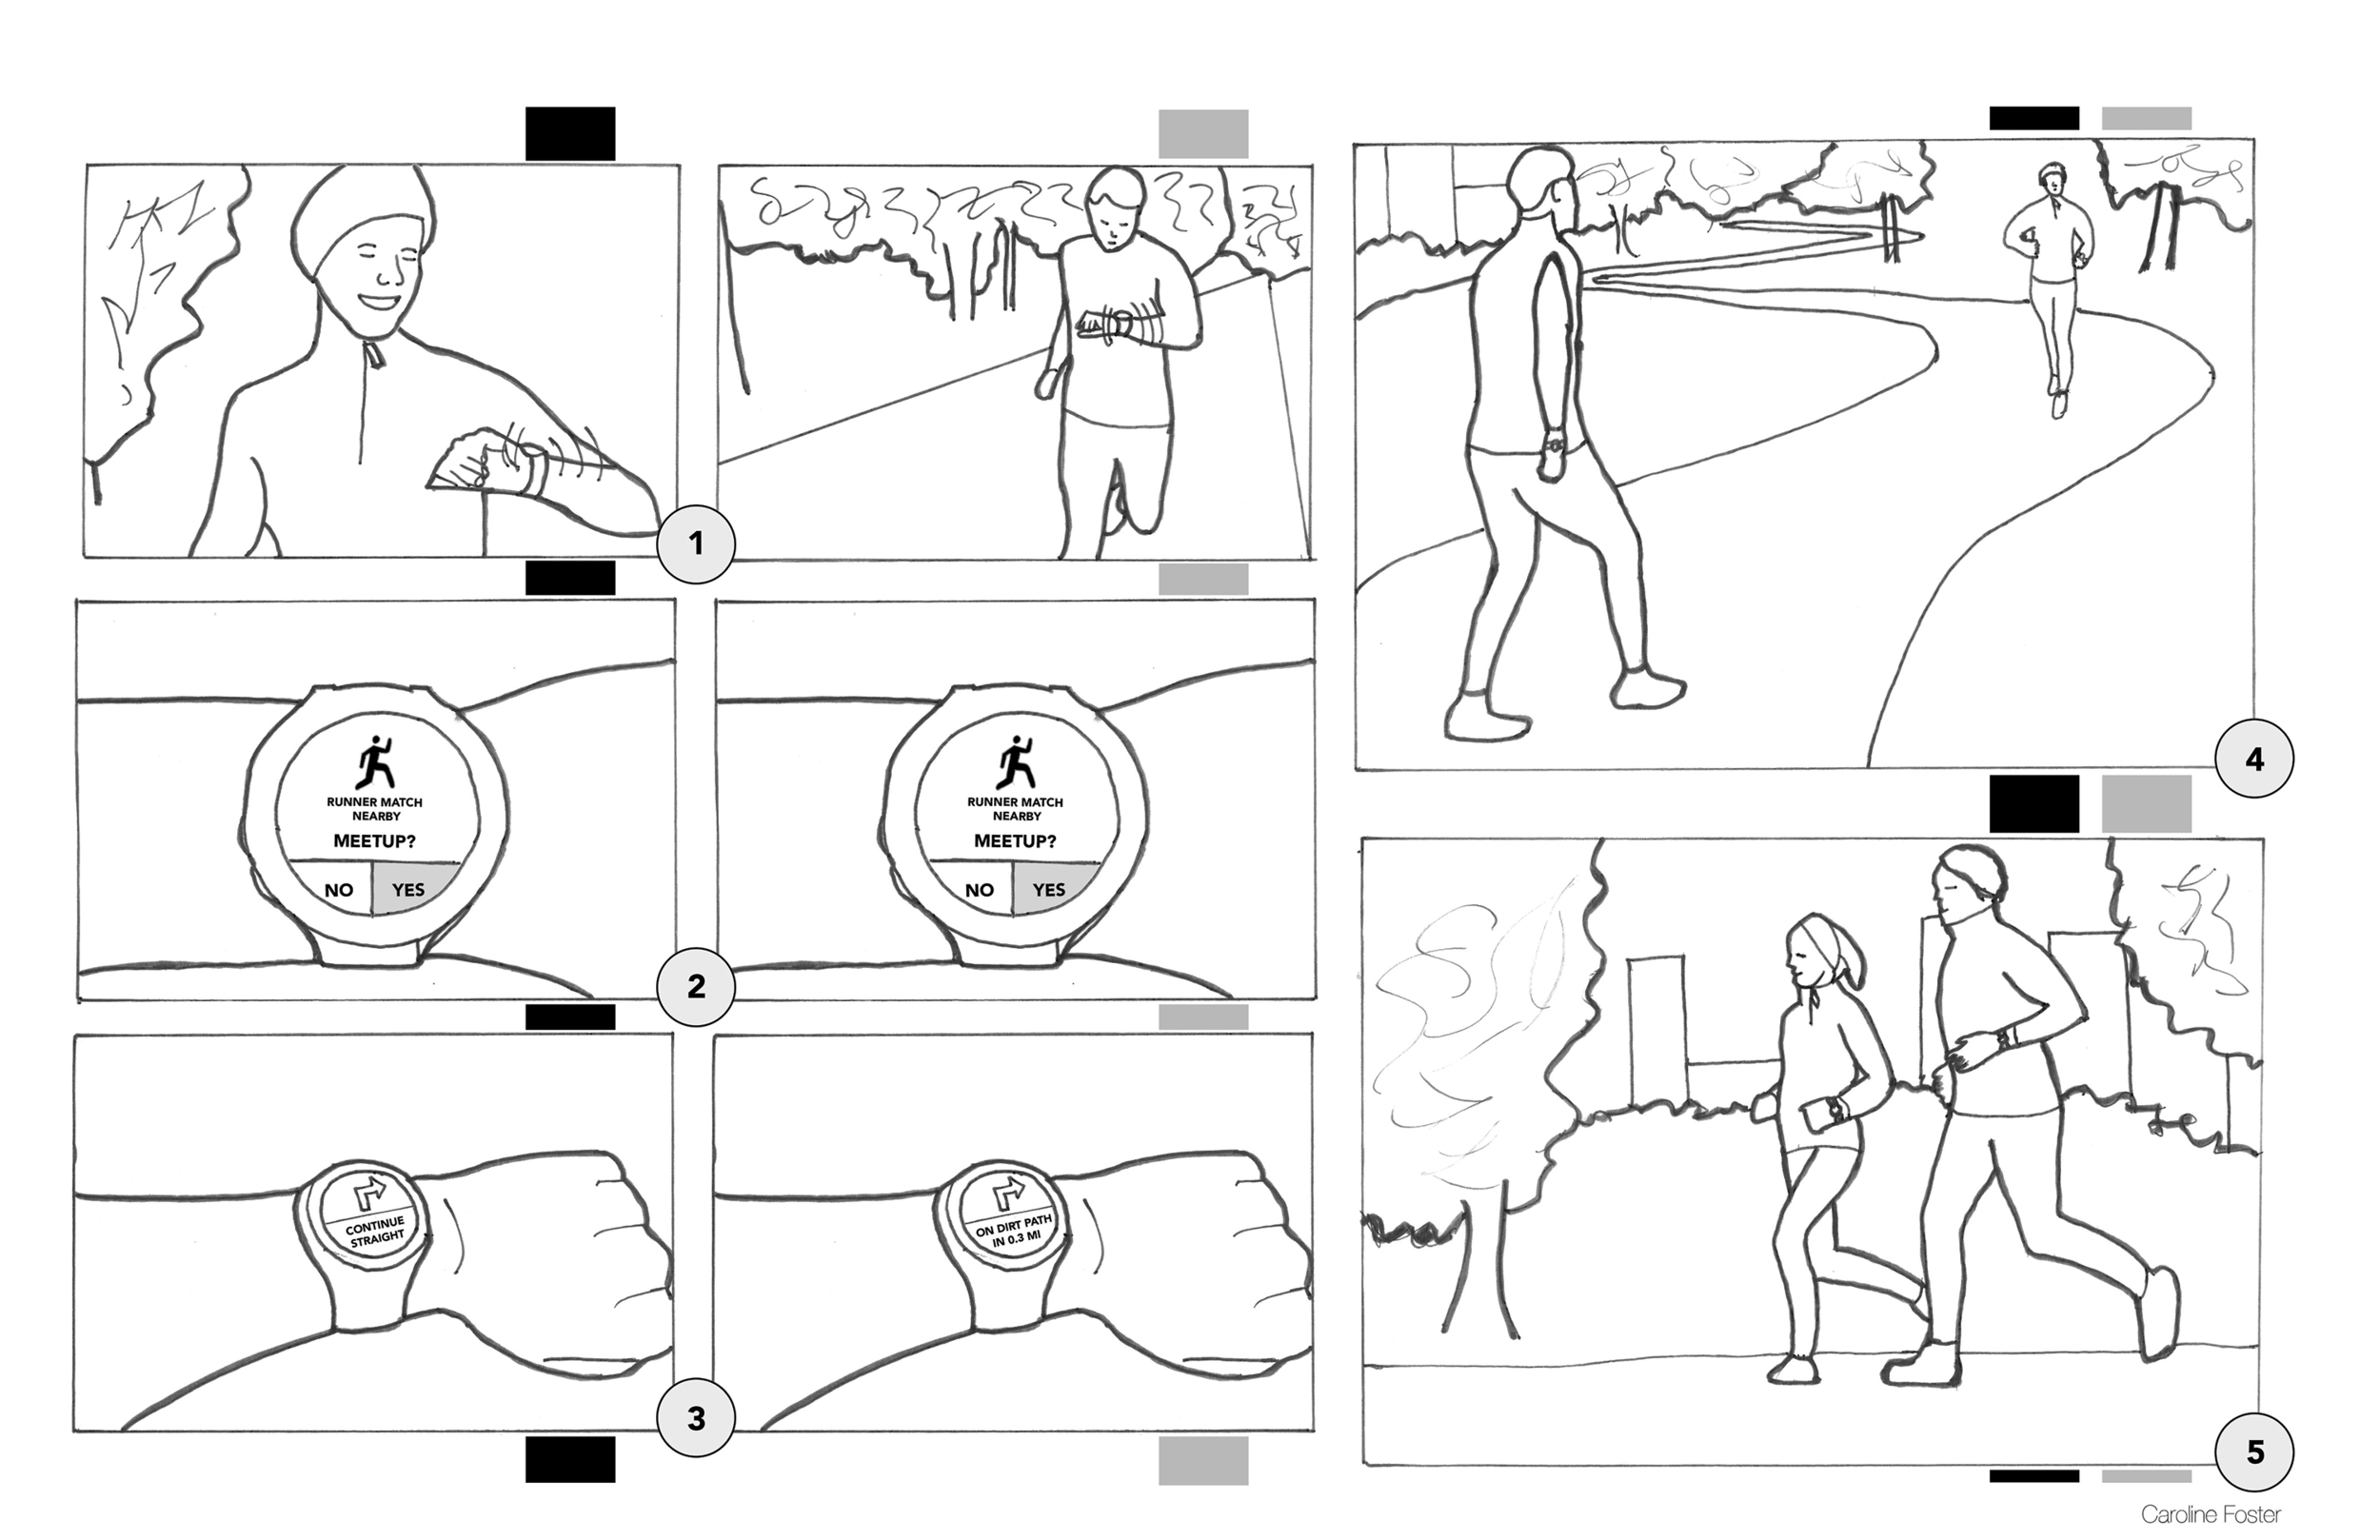
Retrospective for the social connections concept above: High risk of a creep factor. Would recommend cautious exploration and involving privacy partners every step of the way.
User Research
I interviewed 17 people - individually and in pairs or groups up to three. The interviewees were all part of Atlanta Track Club; most were participants in a half or full marathon training program, and a few were staff members. Each semi-structured interview lasted between 20 and 45 minutes, guided by a document of questions I developed beforehand. From these interviews, which I analyzed by categorizing responses, I pulled out a few different types of runners whose needs vary. There are elite runners, casual runners, casual-competitive runners, and new runners. For example, elite runners run between 50 and 60 miles a week, care most about the type of surface they run on, and do not use headphones or their phone during their workouts. Casual runners, on the other hand, run up to 20 miles a week although tend to average closer to 10, care most about the social aspect and a basic level of fitness, and likely run with headphones and their phone.
Design Requirements

Typical training setup at ATC, similar to the environment where I conducted the interviews.
After I completed user interviews, I identified five design requirements.
1. Should not be dependent on runners using WATCH OR PHONE during run. 17 of the 17 runners own smartphones. 11 carry their phone with them during their run. 12 runners use a GPS watch when they are running. This means some runners who use a watch also carry their phone. The 6 who said they do not run with their phone are highly opposed to running with it - citing it as an inconvenience to carry and/or having zero desire to interact with it during their run. For these reasons, the design should not require use of a phone during the run or the use of a watch, since not everyone wants to carry their phone and not everyone uses a watch.
2. Should require MINIMAL INTERACTION w/ tech during run. 6 runners expressed they do not want to be “bothered” by technology during their run. Therefore, they probably want to interact with it as little as possible.
3. Should enable runners to MAKE DECISIONS to improve personal safety. Based on what the participants said they care about, they should be able to make decisions to feel safer during their run.
4. Should enable runners to PICK ROUTES with minimal obstructions. Based on what the participants said they care about, they should be able to pick routes with minimal obstructions and be aware of obstructions when they are blocking their typical route.
5. Should enable runners to PLAN for comfort. Based on what the participants said they care about, they should be able to plan their runs around bathroom and water availability.
Design Decision
Based on these findings and the user requirements, I decided to create a route planning tool for pre-run use. This allows for the majority of technology use to occur before the run, and potentially allows runners to make plans based around the challenges they face running in the city. Many tools for planning a running route already exist, which I discovered and analyzed through a competitive analysis. For this reason, I decided to build features on top of Strava's interface for planning routes. This allowed me to focus on the features related to the integration of smart city data, rather than features that already exist in many tools.
Prototyping
I started with a paper prototype to evaluation among colleagues, and then proceeded to create mid-fidelity prototypes using Sketch and Axure.


User Evaluation
I tested my prototype with 5 runners in ATC’s half or full-marathon training program. No one I tested with was one of the 17 previously interviewed. The testing took place at ATC’s final Saturday training before the half or full-marathon race, at Philippides near Piedmont Park. I recruited the 5 participants by approaching them after they completed their run, as they were stretching or chatting with fellow runners, or they approached me. Since the runners likely did not have their personal laptops with them, I brought mine with the prototype which was used for testing. The testing involved a few initial questions, similar to the needs-gathering interviews, to understand them as a runner and their relationship with technology. I then gave them tasks to complete with the prototype, and asked follow-up and clarification questions.
The testing was more qualitative than quantitative for a few reasons. This is primarily because I was not concerned about quantitative metrics like the time it takes to complete a task. At this point in the design phase, I was more focused on how runners understood the integration of city data into the existing platform, which is harder to measure quantitatively. Therefore, I created tasks divided into two sections. First, I had the participants turn on the toggles in the city panel, use the time slider, and finally use the “export to watch” button. Second, I described a short scenario for which, if completed successfully, would lead them to turn on some toggles and click the “generate routes” button.
Future Work
Based on the results, I identified four specific ways to improve the design. Making these changes does not make it complete.
First, taking time and effort to explore the order and placement of the toggles for each data point would be worthwhile. The order should be based on user priority, with the points most runners are concerned with in the most prominent location.
Second, additional information in general needs to be provided. Some of this information might be immediately readable, and other information might be one interaction away, such as hovering over an item. Additional information that should be considered includes, but is not limited to, the reason for the road closure (event name, construction, etc), details about each data point (what the bathroom is, exactly what “well-lit” means, what makes up air quality), and in non-technical terms, the algorithm behind the “Generated Routes” results.
Third, a design to allow users to input their desired thresholds for each toggle, such as max temperature, to enable to “Generate Routes” feature.
Fourth, the phrasing of the notifications for the “Export to Watch” feature need serious copy consideration.
I focused my efforts solely on the web interface, and left any interaction with the watch, or smartphone, to future work. This would involve notably different considerations involving the design of wearables. For example, attention would need to be devoted to how notifications are received (audio, vibration) and the constraints of a small interface on a watch. Additionally, there are other extensions of the platform that are worth exploring. The data in this iteration are assumed to be generated by the sensor boxes or already (or possibly) exist in some city dataset. Another potential way to generate data is through crowdsourcing by users from the platform, whether actively by the participants or interpreted from the data they generate. The design could be extended to and modified for other active citizens, including walkers and particularly cyclists.